
Once you have chosen an achievement test and administered it, the final step of the annual process is interpreting the score report. I’m sure I’m not alone in feeling that this can be the most intimidating step. The typical score report seems to have more columns of numbers than a tax schedule!
On top of the overwhelming amount of information is the feeling that these numbers represent your success or failure as a homeschool teacher. They do not! The test numbers also do not represent your child’s success or failure. Achievement test scores are not pass/fail! They are a snapshot of your child’s work performance and will give you information about his strengths and pinpoint areas you may want to focus on more. The scores do not indicate if your child has passed a particular grade, and they are not a numeric prediction of future success.
Achievement tests were originally developed to track how well a program of instruction was working by comparing students with the average student in their grade (in the typical curriculum). They are useful to us as homeschool parents to track how much our child improves from year to year and how they compare to the national average in terms of achievement on the test in question. While there are a lot of statistical values derived from these test scores, the most important for our consideration are grade equivalency (GE) and percentile rank. (PR). The number of questions a student answers are converted into these two values for interpretation of the student’s performance relative to the group or grade in question. To understand these you must first understand how these values are distributed across a normal curve.
Test material is composed of tasks and questions which are typical for the designated grade in terms of difficulty and scope. In theory, a third grade test will be composed of questions and concepts that are typical for third grade across the nation. The difficulty range for this material is probably between the second grade and fourth grade to account for the variations between curriculum and student achievement; notice grade three is right in the middle. Thousands of students (the reference group) are given the test and their scores are used to develop the normal curve for this particular instrument. The statistics for this are not complicated, but are more detailed than can be explained here. To simplify: by definition a normal curve shows a distribution of scores where most students fall in the middle range, i.e. average. The mean (average) score is the exact middle of the range of all scores and the number of students achieving that score are represented by the height of the curve. In the chart below, notice that 68% of the students are average because they fall under that part of the curve.
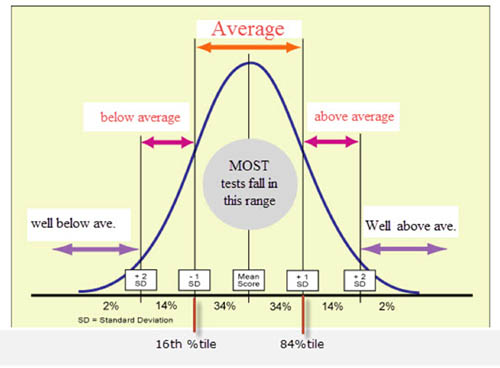
The percentile rank (PR) range is from 1 to 99, with the middle 50 percentile located at the mean test score of the group. The percentile rank indicates how each score relates to the total reference group. A PR of 75 means that 75 percent of the students in the reference group scored lower than your student or that your student scored in the top 25 percent of all students. Remember, percentiles do not tell you how much of the material your student answered correctly; a PR score of 80 does not mean they got 80 percent of the material correct.
Percentiles are useful for three things:
- Percentiles tell you where your student stands compared to others in that grade. A student scoring in the 75 percentile on most achievement tests is at the top of the average range, a student in the 25 percentile is near the lower range for the average student. This is why it is a concern if a student scores below the 25 percentile.
- Percentiles also indicate relative performance between subject areas for a particular student. A student may score 80 percentile in reading and 20 percentile in math and still be average overall. These scores would indicate a weakness in math compared to reading. This could indicate a general weakness in ability or it could mean that more attention needs to be paid to math instruction.
- Percentiles may also tell you if a child is falling behind. A student who scores 25 percentile one year in reading and 15 percentile the next year is falling behind in this skill compared to others in his grade.
Grade equivalency (GE) is the other important score for homeschoolers and also the score most commonly misunderstood. The number of correct answers on a test section is converted to the GE scores for the simple reason that grade level serves as a reference point that most people can understand in terms of the real world of educational material. GE scores are represented by a number like 3.5, where the number to the left of the decimal is the grade and the number on the right is the month of instruction in that grade, in this case a third grader in the fifth month of a nine month school year.
Confusion occurs when these numbers are taken too literally. The third grader who scores GE 6.7 on reading is reading quite well for a third grader, but they are not necessarily reading sixth grade material. They certainly can’t be skipped ahead to the sixth grade in terms of curriculum. The reason you can’t assume the child is ready for sixth grade is that a third grade test would contain only material with a difficulty level slightly above and slightly below third grade. A more accurate way to understand the score is to say that this student is reading as well as a sixth grader would read third grade material. The student would probably not be successful with sixth grade material, but they should be able to read third grade material with relative ease. Therefore, be careful when using GE scores to choose curriculum that you don’t overshoot your child’s instructional level.
On typical standardized tests, GE scores are not helpful in determining the grade level of curriculum to be chosen. They merely represent the approximate level the student is working on when considered as part of the entire test. Seeing a progression of increases in GE in one subject across several years is helpful in tracking student progress. This is especially true in the lower grades where new skills are acquired rapidly. However, in the higher grades, GE scores mean very little because measurable skills are not acquired at the same rapid pace. It is not uncommon for very competent students in eighth grade to have GE of PHS (post high school or above 12.9) in reading. They, however, are most often not ready to read actual college level material.
In general, most students should gain one grade level a year. Students with learning challenges may gain less from year to year while advanced students may often gain several years in twelve months. Again, in this light, GE scores are useful for measuring an individual student’s progress from year to year. A flattening out of growth means attention is warranted in that particular subject.
Grade equivalencies and percentile ranks should always be interpreted together. It is important to understand that a GE score one full grade level below the designated grade may very well be within the average range, though at the lower end. It is typical in any classroom for this to be the case and therefore not particularly useful for parents to obsess over being below grade level one year so long as the child is making progress from year to year. In areas of struggle students may lag for several years and then suddenly make a big leap in GE scores.
On your students score report, the GE and PR scores will be represented in a number of formats, including a chart that shows where they rank on the continuum of achievement. Other values, such as stanine, are also represented and an explanation will be provided for these definitions in the report.
The main score to consider is usually called a composite or broad score as it is derived from a compilation of several subtests in an area or the entire set of subtests. If you want a quick assessment of where your child stands, the composite score provides that. These scores are usually located at the top of the score report.
On the bottom of most score reports is a breakdown of the specific skills tested. For instance, under math computation you will see a list of items such as numeral concepts, addition, subtraction, and fractions. The numbers beside these subtests usually indicate the number of total items on the test, the number your student attempted and the number that was correct. This important information will help you assess particular areas of struggle for your child. However, you may need to consider how the material taught compares to the material tested to reach a conclusion. For instance, on one test, I noticed my child got all the addition, most of the subtraction and one of the fraction problems. This was okay because I knew our curriculum, obviously using a unique sequence, had not introduced fractions. Her scores seemed low until I looked closely to understand how she performed on individual skills. By the next year, I anticipated the scores would level out, and they did.
Another time I noticed that my student didn’t attempt any questions on a significant portion of the end of the math test. The math score was several grades lower than anticipated and quite low in PR. Obviously this student didn’t finish the section in the allotted time. Since this child was particularly capable in math on a day-to-day basis in our curriculum but highly distractible, I assumed he had seen a bird out the window and lost track of the time. I watched his performance on actual math tests to be sure he really had learned the skills he missed on the standardized test and didn’t worry about it anymore. When another of my children demonstrated the same pattern, I remembered noticing they had not finished that section in the allotted time despite working steadily and knew that speed was playing a big role in that test score.
This leads me to an important point about achievement tests. As I mentioned, they provide only a snap shot of your child’s average performance. You should always look at the total picture, which includes day-to-day performance on actual tasks. There are times when students don’t perform well for reasons unrelated to actual ability and achievement.
When you see scores that are outside your expectations, first put yourself in your child’s shoes and ask yourself what could have happened. One friend of mine was very concerned that her child’s grammar score was very low compared to how well she thought he wrote. It turned out that she was using a method of grammar instruction that revolved around writing and copy work. The test required students to find errors. My friend’s son had a hard time figuring out how to answer the questions and find errors since he had never done that before. The next year, she added a small grammar workbook to the weekly assignments, and his scores improved tremendously.
Finally, considering how these tests are scored, it should be obvious that average is where most students in a population are going to fall. We hear reports that homeschoolers typically score higher than the public school comparison and that may be true but don’t let a statistic become a weapon the enemy can use to discourage you if your student is not in that group. Students who score in the average part of the curve are typically bright and capable students who are not experiencing difficulty, but may not be high academic achievers. Achievement tests provide an indicator of success at this time in the academic arena. They are not good indicators of future success as a whole when compared from year to year. Carefully consider if you and your student have done the best that could be done on a day-to-day basis and make changes if you feel the need, but do not fall into the trap of comparing your test scores, good or not so good, to anyone else’s.

ADVERTISEMENT

ADVERTISEMENT